Published on
June 10
If programming is the life of the developer then the logs are the best companion when they are in any trouble!.
Developers when they face any issues in the code or when they want to understand why something is not working as expected; the first place they will be looking would be the logs. The logs give developers a view of what is happening in the code execution when it runs.
Log data helps developers quickly drill down on application related issues including:
Developers use logs or debuggers and sometimes both logs and debuggers. This is a good practice as the debugging tools and the native logging facilities available in the modern IDE’s are good enough to do the job in the development stage.
However, in the deployment stage, If an issue came from a customer and if we are not able to reproduce the issue from our end then debugging the issue using a debugger is difficult and this might not be an apt solution. As the native logging facilities in most of the IDE’s are not providing the ability to access the logs from a remote location native logging feature also will not work here. Some developers even remove them before deployment as there is no way to see them once it’s in the production.
What is Remote Logging
Remote logging is a process of storing the application logs in a remote-storage/cloud storage to provide access from anywhere at any time. This means that the “logs” that an application prints in the console are collected and uploaded to remote storage that is accessible through a network. This service benefits the software developers to access the logs to troubleshoot issues that occur in a production environment and also helps to monitor the software activities in real-time.
Troubleshooting with Remote Logging
Troubleshooting is one of the main reasons developers write logs. When a problem occurs, it has to be diagnosed to understand why it happened and what the cause was. An error message or a sequence of events can give them clues to the root cause, while indicating how to reproduce the issue, and guide them towards the solution.
As we saw, troubleshooting software in production is quite difficult even if we use a modern IDE. This is why remote logging is important for getting the application logs in a remote console to troubleshoot the problem.
Let us now look at some problems the mobile application developers face in an application that is already published and ready to download on stores.
One of the most common issues we hear from the customers are compatibility issues. A feature that worked perfectly on the testing devices failed to work on the customer device. For example, we published an app that collects device GPS location during the signup and tested successfully in our devices but the customer says the sign up is not working. There could be various reasons for the signup failure, it could be because the customer device may not be supporting the GPS feature, or the device couldn’t read the GPS value from the location, etc., We could troubleshoot the problem if we have enough logs from the same device.
However, a remote logging solution can be used here to get the logs and troubleshoot the issue without contacting the customer or even before a customer reports this issue.
AppLogz is a remote logging solution that supports multiple mobile application platforms including Android, iOS and React-Native. In order to get the logs, we have to integrate its mobile SDK in the application. SDK integration is very easy and the documents are available here[Link to SDK doc]. Once the SDK is integrated it must be initialized using a token.
Now let’s collect some logs and push to the remote console. AppLogz also provides the ability to log the messages in different log levels. We can add necessary warning or error logs for the GPS failures which will be pushed to the console.
Along with this message AppLogz collect some meta data and display in the console
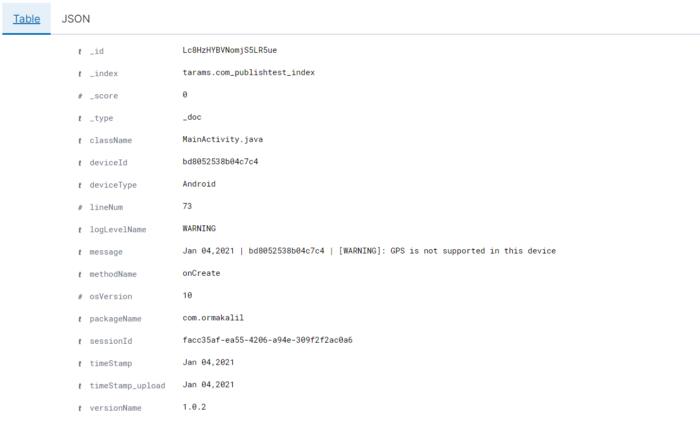
Screenshot: Log detail
Likewise, we can instantly get all the logs we write in the application on the console. With the help of these logs, we can troubleshoot most of the issues that we may face when the application is released to the public.
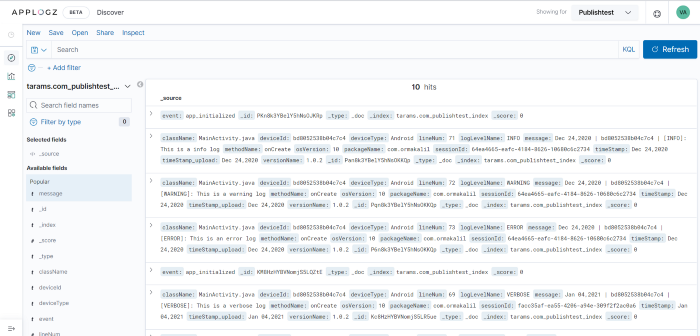
AppLogz uses Kibana, an open-source analytics and visualization platform which provides beautiful visualizations and dashboards. A visualization is worth a thousand log lines, and Kibana provides many options for showcasing the data
With Discover, we can explore all the logs data we have pushed from the app
Apart from collecting and displaying the logs in the console, AppLogz is integrated with many more features. Checkout the features here
As a mobile application developer whenever we hear the word crash reporting the first thing that will come into our mind would be Crashlytics. Crashlytics is popular and its library is integrated into most of the applications. Crashlytics is primarily classified as a “Mobile Error Monitoring” but not a “Log Management” tool.
Some of the major features difference between Crashlytics and AppLogz are :
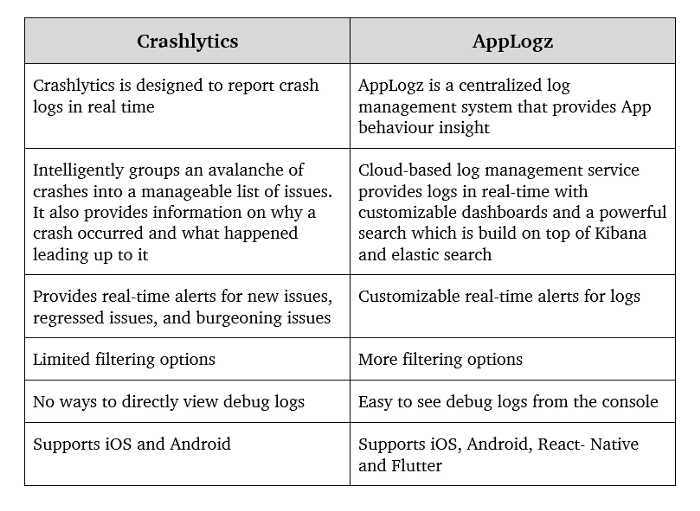
When it comes to crash reporting, there is no doubt Crashlytics is the best in the business. But when it comes to Log management, it lacks some key features and AppLogz fills in the gap here.
 Back
Back